US recorded 16.8 GW wind power capacity in 2020
POWER & RENEWABLE ENERGY

US recorded 16.8 GW wind power capacity in 2020

The United States recorded 16.8 GW wind capacity addition in 2020. Wind power was estimated to be 42% of the added capacity in 2020, implying an investment of $24.6 billion.

The levelised prices for newly constructed projects were found to be just more than $33 per MWh, as per a report by the US Department of Energy.

The report was published by Lawrence Berkeley National Laboratory.

Total wind capacity grew to about 122 GW. Additionally, 3,087 MW of existing wind plants were partly repowered in 2020 by enhancing rotors and major nacelle parts of existing turbines.

In 2020, wind energy composed 42% of all new capacity increases, moving forward of solar energy for the first time in many years. It was despite a record-breaking year for solar capacity increases, while natural gas capacity increases dipped to a five-year low.

The national average cost of wind power purchase agreements (PPA) has fallen from a high of $70 per MWh in 2009 to $20 per MWh in the central region of the country and an average of $30 per MWh in the east and west. Low PPA costs have been facilitated by the combination of higher capacity factors, decreasing installation and operation charges, and low interest rates. The production tax credit has also been an important enabler.

Texas established the most capacity in 2020 with 4,137 MW, while 16 states surpassed 10% wind power penetration as a fraction of total in-state production. Oklahoma, Iowa, Wyoming, Illinois, and Missouri all added over 1 GW of new wind in 2020.

Wind generated 68.6% of the electricity sold in Iowa. Kansas with 61.2% and North Dakota with 61.7% were the other states where wind produced over 50% of the electricity sold. Sixteen states have reached wind penetration levels of 10% or above.

The average wind turbine costs were determined to be $775 per kW to $850 per kW. The average established cost of wind plants in 2020 was $1,460 per kW, dipped over 40% since the peak in 2010. These cost reductions, combined with enhanced turbine technology, have exerted downward pressure on project expenses and allowed decreases in wind power costs and the Levelized cost of wind energy.

In 2020, General Electric Company owned 53% of the U.S. market for turbine establishments, accompanied by Vestas at 34% and SiemensGamesa Renewable Energy at 9%. Vestas was also the world’s biggest supplier of wind turbines last year across the onshore and offshore wind, as per the preliminary rankings given by the Global Wind Energy Council Market Intelligence.

Jobs related to wind in the United States rose in 2020 to 116,800 full-time workers despite Covid-19.

Independent power generators held 73% of the new wind capacity established in 2020, with the remaining 27% controlled by investor-owned utilities.

As per a report from Wood Mackenzie, a total of 114 GW of new wind capacity was added worldwide in 2020, signifying an 82% rise year-over-year. It is the largest global yearly installation total on record.

Image Source


Also read: India adds 2,488 MW solar capacity in Q2, rising 19% QoQ over Q1

The United States recorded 16.8 GW wind capacity addition in 2020. Wind power was estimated to be 42% of the added capacity in 2020, implying an investment of $24.6 billion. The levelised prices for newly constructed projects were found to be just more than $33 per MWh, as per a report by the US Department of Energy. The report was published by Lawrence Berkeley National Laboratory. Total wind capacity grew to about 122 GW. Additionally, 3,087 MW of existing wind plants were partly repowered in 2020 by enhancing rotors and major nacelle parts of existing turbines. In 2020, wind energy composed 42% of all new capacity increases, moving forward of solar energy for the first time in many years. It was despite a record-breaking year for solar capacity increases, while natural gas capacity increases dipped to a five-year low. The national average cost of wind power purchase agreements (PPA) has fallen from a high of $70 per MWh in 2009 to $20 per MWh in the central region of the country and an average of $30 per MWh in the east and west. Low PPA costs have been facilitated by the combination of higher capacity factors, decreasing installation and operation charges, and low interest rates. The production tax credit has also been an important enabler. Texas established the most capacity in 2020 with 4,137 MW, while 16 states surpassed 10% wind power penetration as a fraction of total in-state production. Oklahoma, Iowa, Wyoming, Illinois, and Missouri all added over 1 GW of new wind in 2020. Wind generated 68.6% of the electricity sold in Iowa. Kansas with 61.2% and North Dakota with 61.7% were the other states where wind produced over 50% of the electricity sold. Sixteen states have reached wind penetration levels of 10% or above. The average wind turbine costs were determined to be $775 per kW to $850 per kW. The average established cost of wind plants in 2020 was $1,460 per kW, dipped over 40% since the peak in 2010. These cost reductions, combined with enhanced turbine technology, have exerted downward pressure on project expenses and allowed decreases in wind power costs and the Levelized cost of wind energy. In 2020, General Electric Company owned 53% of the U.S. market for turbine establishments, accompanied by Vestas at 34% and SiemensGamesa Renewable Energy at 9%. Vestas was also the world’s biggest supplier of wind turbines last year across the onshore and offshore wind, as per the preliminary rankings given by the Global Wind Energy Council Market Intelligence. Jobs related to wind in the United States rose in 2020 to 116,800 full-time workers despite Covid-19. Independent power generators held 73% of the new wind capacity established in 2020, with the remaining 27% controlled by investor-owned utilities. As per a report from Wood Mackenzie, a total of 114 GW of new wind capacity was added worldwide in 2020, signifying an 82% rise year-over-year. It is the largest global yearly installation total on record. Image Source Also read: India adds 2,488 MW solar capacity in Q2, rising 19% QoQ over Q1

Next Story
Resources

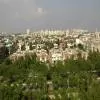
Madhya Pradesh Champions Inclusive Tourism at Heritage Sites

On the occasion of World Heritage Day, Madhya Pradesh is taking a significant step toward inclusive tourism by making its historical sites accessible to all — especially persons with disabilities. The state is rolling out its ‘Accessibility Infrastructure and Development’ project at Maheshwar, Mandu, Dhar, and Orchha, aiming to create a more welcoming experience at these iconic cultural destinations.The initiative, under the leadership of Chief Minister Dr Mohan Yadav and Tourism Minister Shri Dharmendra Bhav Singh Lodhi, includes infrastructure upgrades such as ramps, Braille signage, w..

Next Story
Resources

Runwal Realty Onboards Sonam Kapoor as Brand Ambassador

Real estate major Runwal has unveiled a refreshed identity as Runwal Realty, signalling a renewed commitment to crafting spaces that stand the test of time. With this refresh, the brand unveils its new philosophy: “Building for Generations to Come” and welcomes Bollywood star and global fashion icon Sonam Kapoor as its brand ambassador. This evolved identity reflects Runwal Realty’s commitment to creating not just homes, but heirlooms—crafted through visionary design, meticulous planning, global design expertise and an unwavering focus on quality. With the customer at its core, each de..

Next Story
Infrastructure Urban

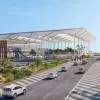
Emerging Trends in Infrastructure and Transport 2025: KPMG

KPMG’s latest report, The Great Reset: Emerging Trends in Infrastructure and Transport 2025 edition, sheds light on the profound changes transforming the global infrastructure landscape. As industries adapt to the challenges posed by climate change, economic pressures, and technological advancements, the report identifies key trends and provides actionable insights for leaders in infrastructure and transport sectors. “In today’s interconnected world, the lack of standardized supply chain practices is not just an operational challenge—it’s an environmental and economic one. We’..

Advertisement

Advertisement

Subscribe to Our Newsletter

Get daily newsletters around different themes from Construction world.

STAY CONNECTED

Advertisement

Advertisement

Advertisement

Advertisement

Talk to us?