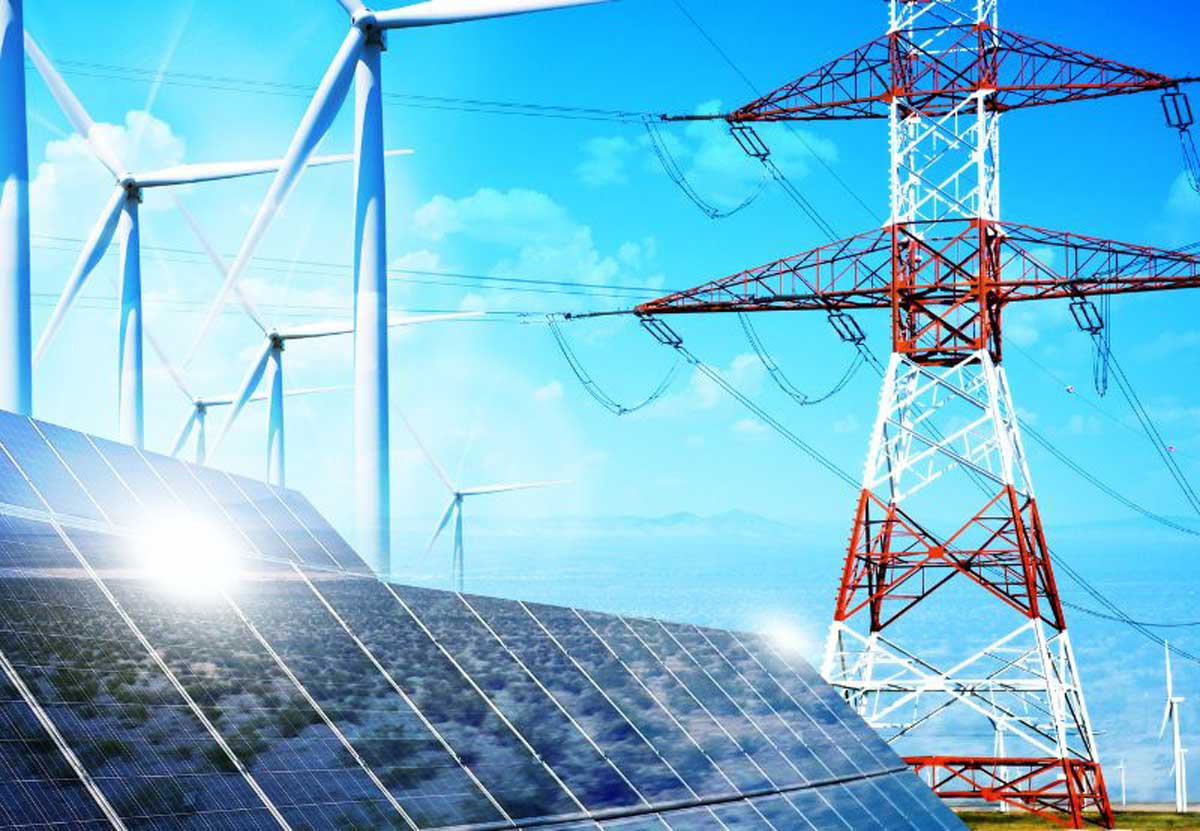
Renewable Energy grows in captive power sector: CEA's 2023 Report

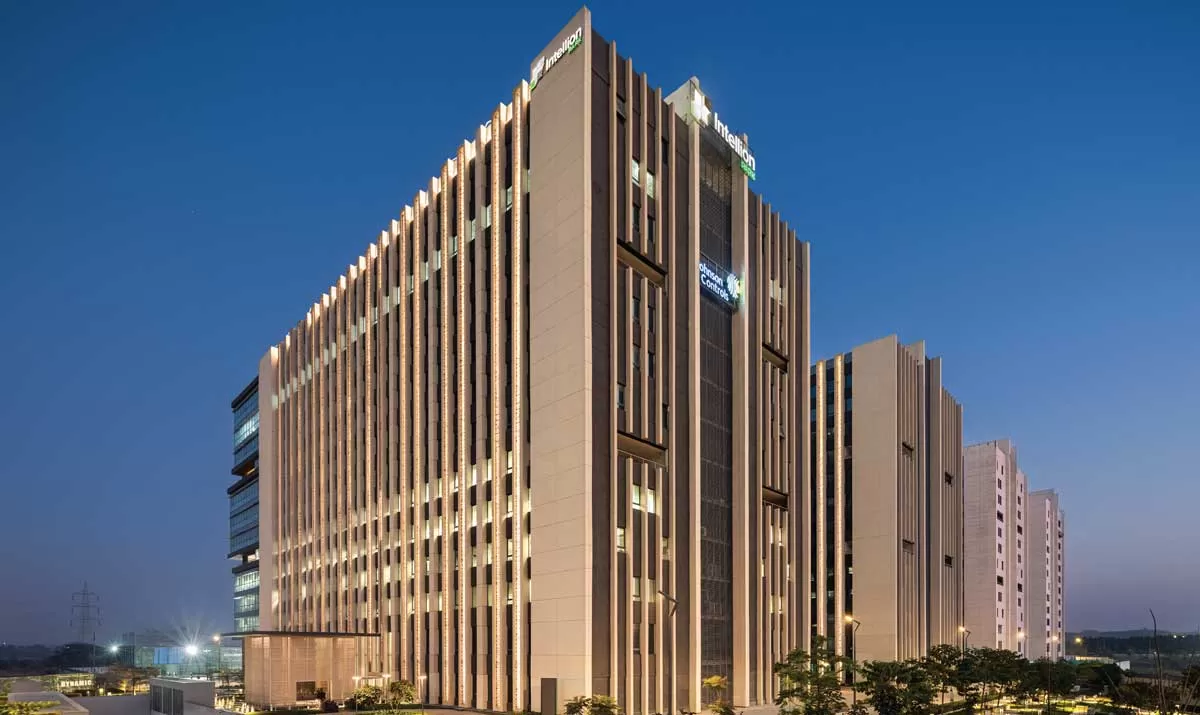
Tata to Establish Rs 32.73 Bn IT Park in Whitefield, Bengaluru
The Karnataka Government has granted approval to Tata Realty and Infrastructure Limited (TRIL) to establish a cutting-edge IT and ITES business park in Bengaluru, entailing an investment of Rs 32.73 bn. The forthcoming Tata Intelion Park will be situated within the Doddanekkundi Industrial Area in Whitefield, spanning 25.5 acres. The development is projected to generate employment opportunities for approximately 5,500 individuals. TRIL acquired the land from Graphite India Limited in August 2023 at a cost of Rs 9.86 bn. The park will comprise infrastructure for IT, retail, and associated ser..
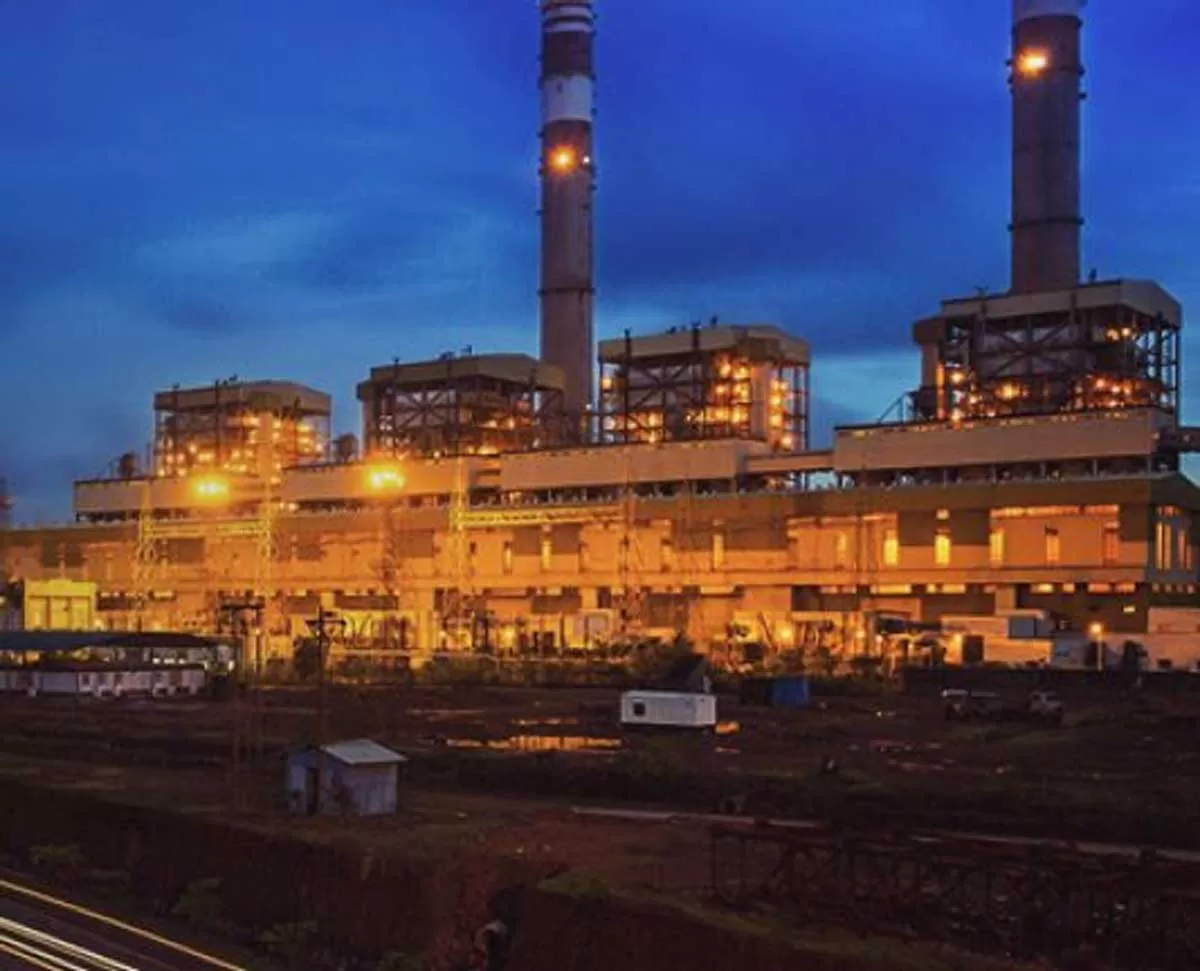
JSW Energy’s Rs 160 Bn Salboni Plant Most Cost-Efficient
JSW Energy’s Rs 160 bn capital expenditure for setting up a 1,600-MW ultra-supercritical thermal power plant at Salboni, West Bengal, is among the most competitive in terms of cost per megawatt, according to company officials. The Salboni project, comprising two units of 800 MW each, marks the company’s largest greenfield power development and its first major entry into eastern India. JSW already operates a cement grinding unit at the Salboni site in West Medinipur district. “This is the largest greenfield investment by the company and holds strategic significance,” stated JSW Energy..
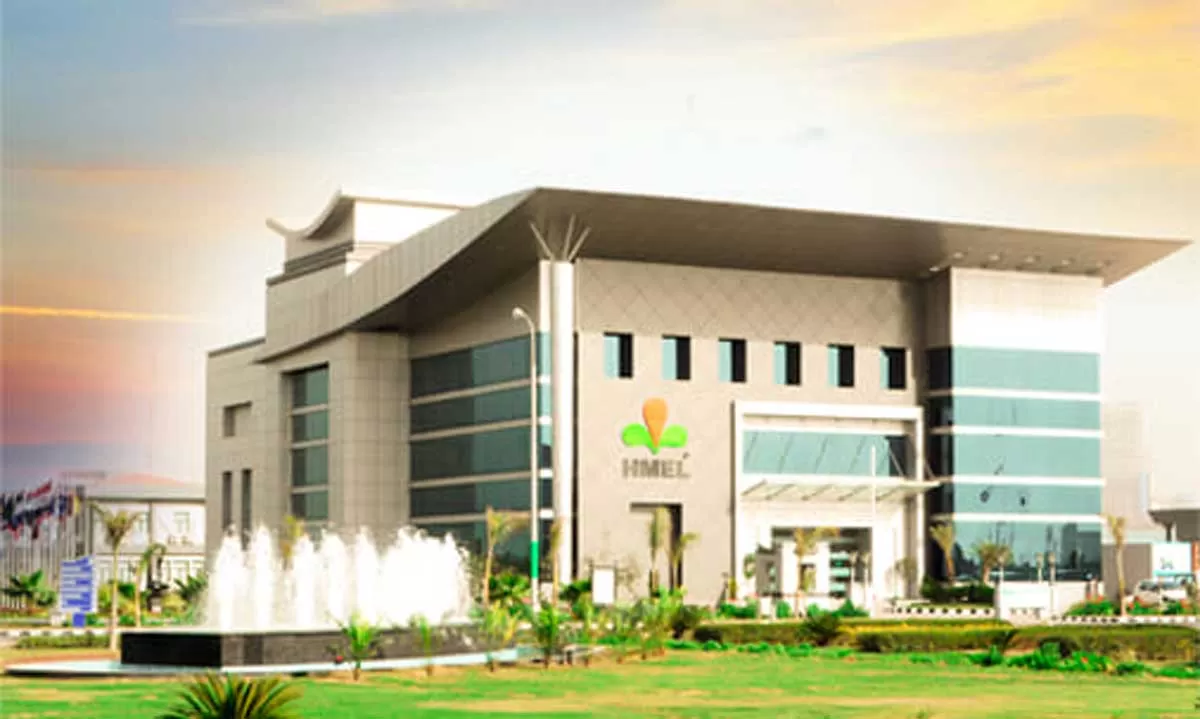
HMEL and IIT Kanpur to Collaborate on Advanced Energy R&D
HPCL-Mittal Energy Limited (HMEL) has signed a memorandum of understanding (MoU) with the Indian Institute of Technology Kanpur (IIT Kanpur) to jointly pursue research and development in new products, processes, and technologies within the energy sector. In a statement, HMEL said the collaboration would centre on pioneering R&D initiatives with tangible impact, including the development of sustainable energy technologies, process innovations, advanced materials, and AI-enabled energy systems. Both institutions aim to bridge the gap between academic research and industrial application, convert..
Latest Updates